ALN Sessions - for NQ2/24/25 - v1
This script does not calculate any stats.
It uses the sessions and stats from NQStats/ALNSessions
Option to draw boxes around the session times.
Options to adjust the table text/background colors/position.
The logic will determine how the Asia and London sessions interact.
Once the New York session starts (8am), it will then display the appropriate stats.
Script quirk...fyi. The script removes the stats table at 6PM.
That's just how it works. I used grok to assist with the code, and it got funky. It works, so I left it that way.
The appropriate stats table will then be displayed when the next New York session begins.
---
There is another table I used just for troubleshooting to show the values of the Asia/London session highs/lows. This can just be ignored.
3/3/25 - republished.
Search in scripts for "session high"

Average Daily Range ProjectionsCreates a trailing high and low projection based on the Average Daily Range.
Track the Session High and Low to determine the Daily Range.
Average the Daily Range by a fixed Period to create an Average Daily Range .
Track the Prior Daily Range .
Track the Current Daily Range .
Track the % of Range completion relative to the CDR & ADR(P).
From the Session Low, project an Average Daily Range High by adding the ADR.
From the Session High, project an Average Daily Range Low by subtracting the ADR.
When %R reaches 100% or greater, the ADR HI & LO will lock, showing the range break out or break down. As the Session High and Low create the Daily Range, observe the reaction of price as it reaches the limit of the expected daily range.
On strongly trending days, CDR is likely greater than PDR and ADR(P). Price can break away.
On ranging days, %R may fail to reach 100% and CDR may be lesser than PDR and ADR(P). Price can bounce around within the bounds of ADR HI & LO.

Daily Session Fibonacci LevelsPlots automatic Fibonacci retracement levels based on the current session high and low.
Levels for the prior and current session can be toggled on/off.
Optional: Toggle to show the Fibonacci Level labels.
Allows for customizable levels and colors; toggles for individual levels.

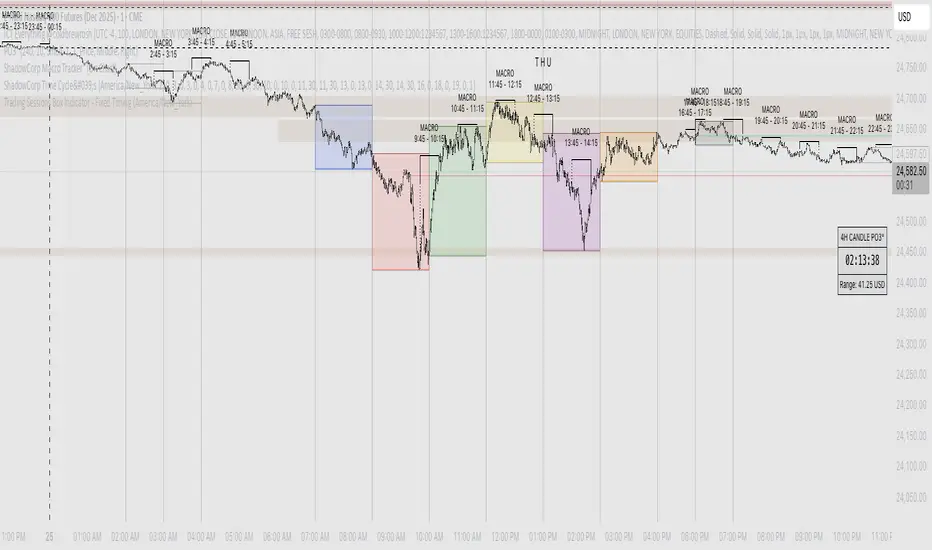
ICT Killzones + Macros [TakingProphets]The ICT Killzones indicator is a powerful tool designed to visualize key trading sessions and market timing elements used in ICT (Inner Circle Trader) methodology. It includes:
• Session Markers:
- Asia Session
- London Session
- NY AM Session
- NY Lunch Session
- NY PM Session
• Key Price Levels:
- Session high/low levels that extend until violated
- Midnight Open price level (dotted line)
- True Day Open price level (6 PM EST, dotted line)
• ICT Macro Timing:
- First Macro: 9:45 AM - 10:15 AM EST
- Second Macro: 10:45 AM - 11:15 AM EST
- Distinctive L-shaped brackets marking start and end times
Features:
• Fully customizable colors and styles for all elements
• Adjustable label positions and sizes
• Toggle options for each component
• Smart timeframe filtering
• Clean, uncluttered visual design
This indicator helps traders identify key market structure points, session transitions, and optimal trading windows based on ICT concepts.

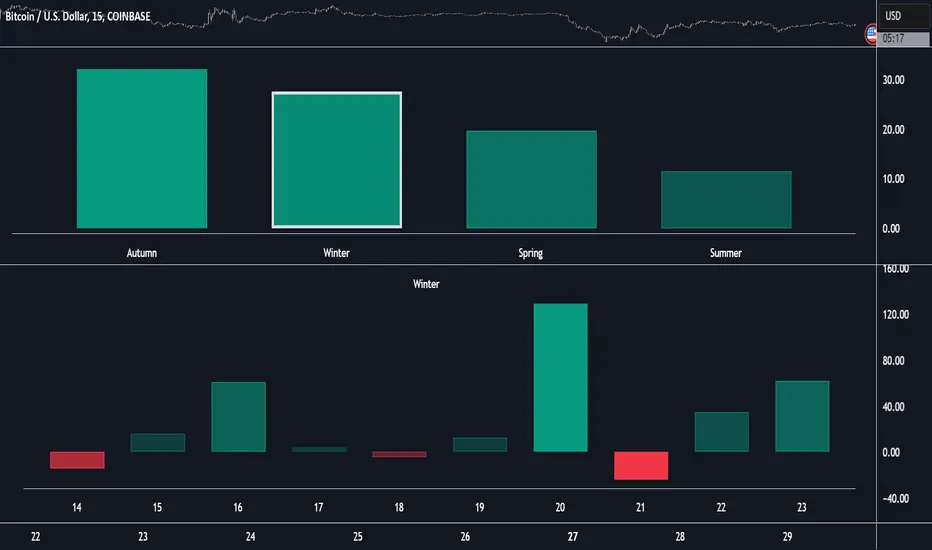
Market Performance by Yearly Seasons [LuxAlgo]The Market Performance by Yearly Seasons tool allows traders to analyze the average returns of the four seasons of the year and the raw returns of each separate season.
🔶 USAGE
By default, the tool displays the average returns for each season over the last 10 years in the form of bars, with the current session highlighted as a bordered bar.
Traders can choose to display the raw returns by year for each season separately and select the maximum number of seasons (years) to display.
🔹 Hemispheres
Traders can select the hemisphere in which they prefer to view the data.
🔹 Season Types
Traders can select the type of seasons between meteorological (by default) and astronomical.
The meteorological seasons are as follows:
Autumn: months from September to November
Winter: months from December to February
Spring: months from March to May
Summer: months from June to August
The astronomical seasons are as follows:
Autumn: from the equinox on September 22
Winter: from the solstice on December 21
Spring: from the equinox on March 20
Summer: from the solstice on June 21
🔹 Displaying the data
Traders can choose between two display modes, average returns by season or raw returns by season and year.
🔶 SETTINGS
Max seasons: Maximum number of seasons
Hemisphere: Select NORTHERN or SOUTHERN hemisphere
Season Type: Select the type of season - ASTRONOMICAL or METEOROLOGICAL
Display: Select display mode, all four seasons, or any one of them
🔹 Style
Bar Size & Autofit: Select the size of the bars and enable/disable the autofit feature
Labels Size: Select the label size
Colors & Gradient: Select the default color for bullish and bearish returns and enable/disable the gradient feature
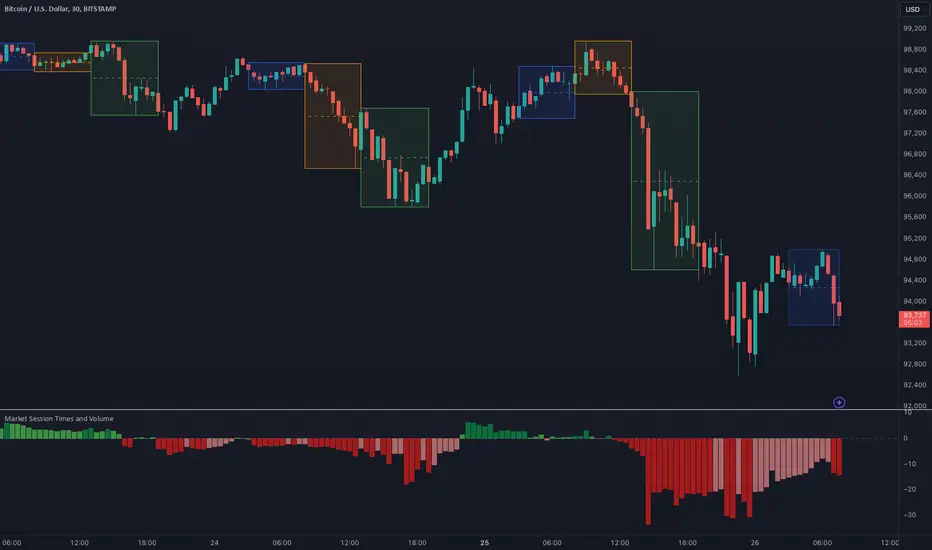
Market Session Times and Volume [Market Spotter]Market Session Times and Volume
Market Session Times
Inputs
The inputs tab consists of timezone adjustment which would be the chosen timezone for the plotting of the market sessions based on the market timings.
Further it contains settings for each box to show/hide and change box colour and timings for Asian, London and New York Sessions.
How it works
The indicator primarily works by marking the session highs and lows for the chosen time in the inputs, each of the sessions can be input a custom time value which would plot the box. It helps to identify the important price levels and the trading range for each individual session.
The midpoint of each session is marked with a dashed line. The indicator also marks a developing session while it being formed as well to identify potential secondary levels.
Usage
It can be used to trade session breakouts, false breaks and also divide the daily movement into parts and identify possible patterns while trading.
2. Volumes
Inputs
The volume part has 2 inputs - Smoothing and Normalisation. The smoothing period can simply be used to take in charge volumes of last X bars and normalisation can be used for calculating relative volumes based on last Y bars.
How it works
The indicator takes into account the buy and sell volumes of last X bars and then displays that as a relative smoothed volume which helps to identify longer term build or distribution of volume. It plots the positive volume from 0 to 100 and negative volume from 0 to -100 which has been normalised. The colors identify gradual increase or decrease in volumes
Usage
It can also be used to trade volume spikes well and can identify potential market shifts
SMC Fake Zones + InsideBarThis indicator is useful for whom trade with "Smart Money Concept (SMC)" strategy.
It helps SMD traders to identify fake or weak zones in the chart, So they can avoid taking position in this zones.
This indicator marks "Asia session" as well as "London and New York's Lunch Time (one hour before London and NY session starts)" zones.
It also marks Inside Bar candles which SMC trades consider as order flow. You can mark every Inside Bar or only those with opposite color via setting options.
*** As we know in SMC rules
1- Supply and Demand zones in "Asia session and Lunch Times" are fake zones for SMC trading and price will engulf them in most of times.
2- "Asia session high and low" has huge liquidity and usually price sweep that in London session.
This indicator will helps traders to visually identify those Fake zones and Asia session liquidity.
* You can change session times based on your time zone in settings.
* You can set options to show all Inside Bars or only with Opposite color in settings.

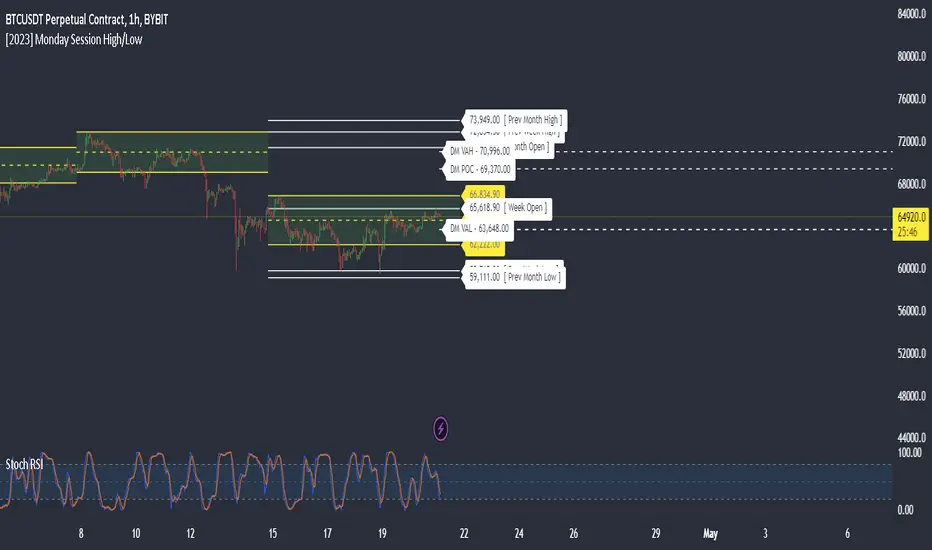
Monday Session High/LowThis script tracks and draw the High and the Low for Monday session across the whole week period.
Many crypto traders use the high and low extremes for Monday session as an confluence on how the price action during the week reacts against it.
Indian Market Sessions for BacktestingThis indicator is designed to increase the quality of your backtesting in the Indian Market.
NSE & BSE run from 9:15 am IST to 3:30 pm IST.
Naturally different times have different kinds of volatility.
On your chart you will find premarked -
Saffron - 9:15 am to 10:30 am - Opening Session - High Volatility Observed Historically
White - 10:35 am to 2:25 pm - Middle Session - Lower Volatility Observed Historically
Green - 2:30 pm to 3:30 pm - Closing Session - Medium to High Volatility Observed Historically
You will also find the start of each session marked with an arrow.
Feel free to change the times from the input settings and the color and visibility from the style settings.
_______________
Usage:
When you backtest any strategies, say moving average crossovers, also mark the sessions in your sheet which will help you further increase accuracy.
Feel free to drop your doubts in the comments.

Daily Gaps & Trapped PositionsThis script builds substantially upon the default Gaps script provided by Tradingview. Functionality was added to allow users to decide what price from the previous session is used to determine a daily gap, added support for showing gaps across all timeframes up to the daily time frame, and also allow gaps to be shown even with ETH enabled on the chart. This script provides support across normal securities, futures, and also crypto.
Users can decide between the following selections to determine if a daily gap has formed:
- Previous Session Close
- Previous Session High/Low
- Last RTH Candle High/Low
The other larger piece that was added is something called trapped positions or what some folks familiar with Market Profile would call "single prints". They could also be considered FVGs but they are a specific subset of FVGs as these must from above or below the current session's high/low.
Single prints form above or below a current session's high/low and can be considered an area where price has moved too fast in that area and price will most likely return to these areas at a later point in time. In some teachings, these are also looked at as "trapped shorts" (lighter blue box color) or "trapped supply" (yellow orange box color) which creates an area where there will be potential support (trapped shorts) or resistance (trapped supply) when this area is revisited in the future. Adding these to your chart will simply provide additional areas of interest where you may see buying or selling.
Both gaps and trapped positions have the following options:
- Show only active gaps/trapped positions. Selecting this will only show areas where price has not completely traded through the box.
- Close gaps/trapped positions partially. If this is selected, it will reduce the box size as price is traded through the area. If it is not selected, the box will only disappear once price has traded through the entire box completely.
There are some additional settings that allow you to tailor how many boxes show up on the chart. These settings are as follows:
- Max number of boxes. This setting will only plot up to this number of gaps/trapped positions.
- Minimum Deviation. This will prevent gaps/trapped positions from showing if they are too small relative to average across that last 14 periods.
- Limit Max Box Trail Length (bars). If checkbox is selected, the box will stop being extended after X number of bars given in this input.

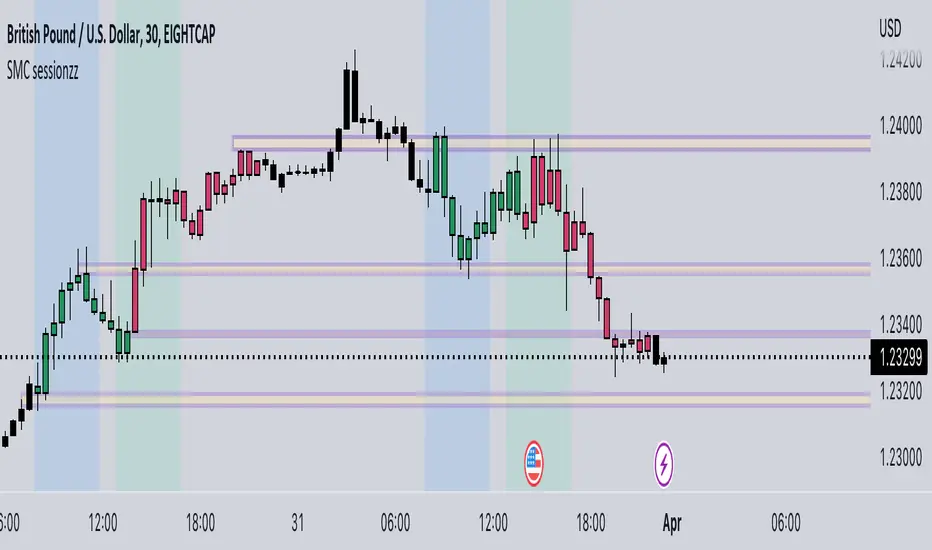
SMC sessionzz by JelleThe main function of this indicator is to make it easy to identify several smart money concepts (SMC) and ICT practices by using a single indicator. The functions themselves are not my original content, but rather a collection of several scripts with some tweaking, combined into a single indicator.
Main functions:
- Provides the ability to set bar color for London, New York and Asia sessions
- Provides the ability to set background color for London, New York and Asia sessions
- Provides the ability to indicate NY and GMT midnight on the chart by plotting vertical lines
- Provides several smart features to turn bar color and background color on/off depending on the timeframe
Usage example:
- Easily determine each session high and low by using the bar color feature
- Easily determine the daily high and low by using the vertical midnight lines
- Easily determine ICT kill zones by setting background color for each session
- Easily avoid clutter on your chart by using the timeframe filters
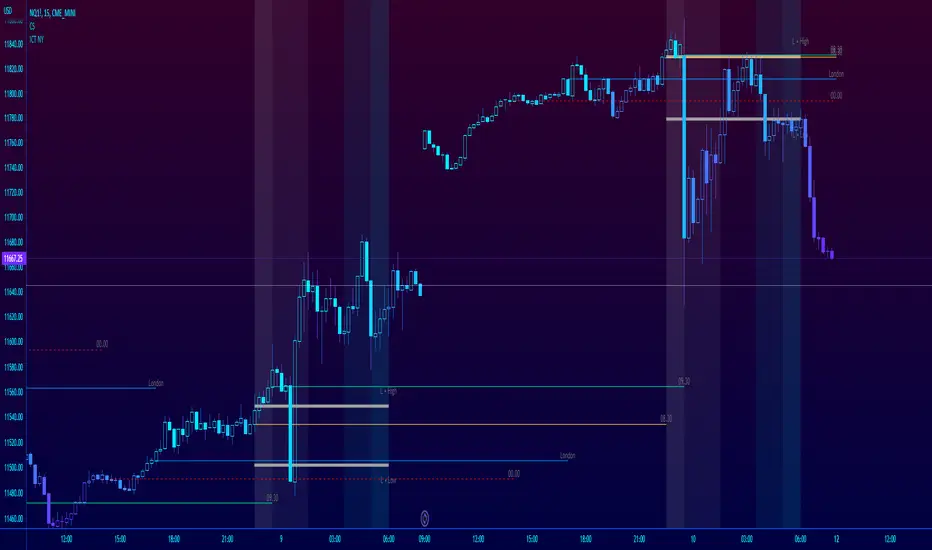
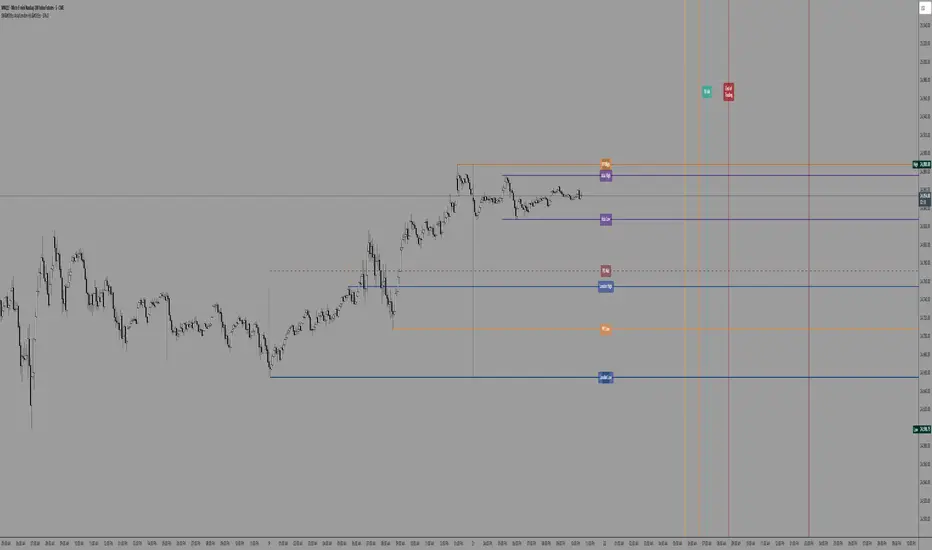
ICT NY Futures Indices Session Model - YT New York MentorshipThis indicator plots out the time periods and open lines as outlined in ICT's 2022 Mentorship and is designed specifically for the New York futures trading session.
Time zone is set to GMT-4 (NY) by default but can be changed for accommodate daylight saving in the menu.
Please note this indicator is to be used only on the 30min timeframe and below.
Here are its features:
The background color shows the morning session, in two parts (8.30am to 9.30am and 9.30am to 11.30am), then a two hour gap for lunch (ICT calls this "Dead time") and finally, the afternoon session, also to two (1.30pm to 3pm and 3pm to 4pm).
It not only shows the current killzones, but future zones as well.
These times are important; trades can be framed within these zones as taught in the mentorship.
Next are the open lines. These lines are automatically plotted and can be areas for price to react off of; they are the opening price of a candle at these times:
00.00 (New York Midnight, also known as "True Day Open")
8.30am (New York Equities pre-open)
9.30am (New York Equities open)
2.00am (London Stock Exchange open)
And lastly, London's trading session High and Low are projected forward onto the New York trading session.
These two price points are areas of liquidity that were pooled during London, but they can also often set the high or low of the day.
Please let me know if there are any bugs or if you have suggestions for the next update.

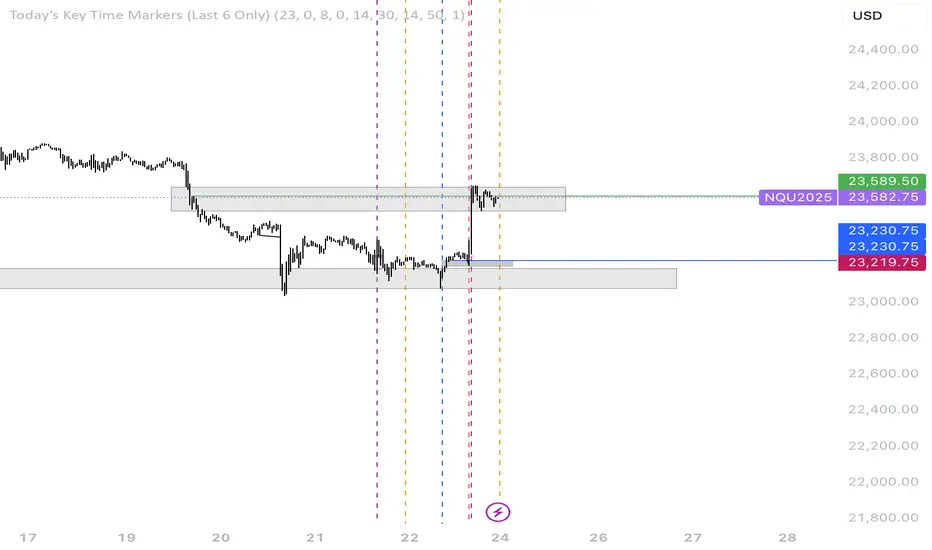
Opening Range + Prev/Pre/Post Market Hi/Lo
Tracks each day’s regular-session high/low and their bar_index.
On a new day, stores those as “prev day” values.
Draws the prev-day lines anchored at the actual high/low bars from yesterday, then extends them across today (and beyond).

Multi-EMA Session Breakout Strategythis is a strategy that use the session high and low and the EMA LOWS 2 3 6 9 110 355 AND 480
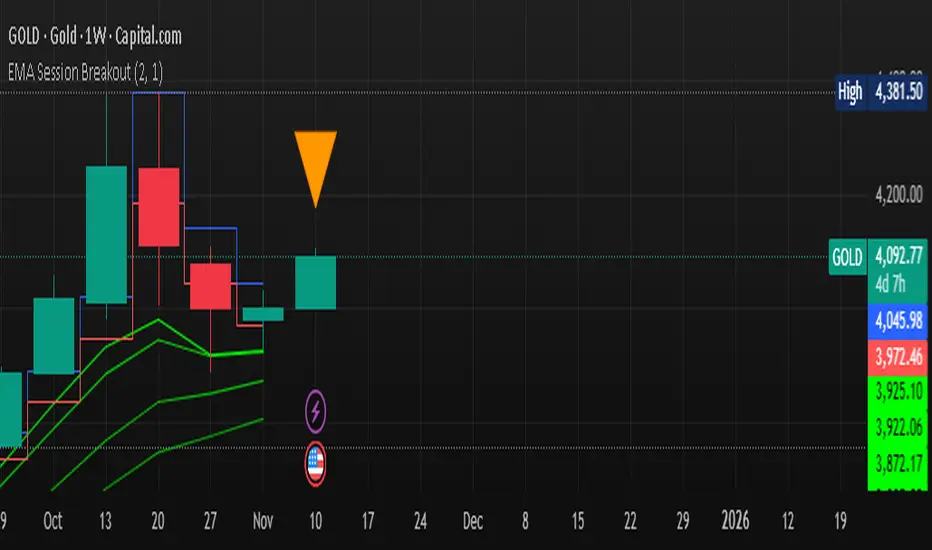
GutroThis TradingView indicator automatically plots Fibonacci retracement levels based on the day’s first confirmed swing between the session high and low (9:30 AM – 4 PM ET). It includes dynamic 0%, 38.2%, 50%, 61.8%, and 100% levels, a shaded golden zone, VWAP bands with standard-deviation envelopes, and a 9/21 EMA ribbon for trend confirmation.
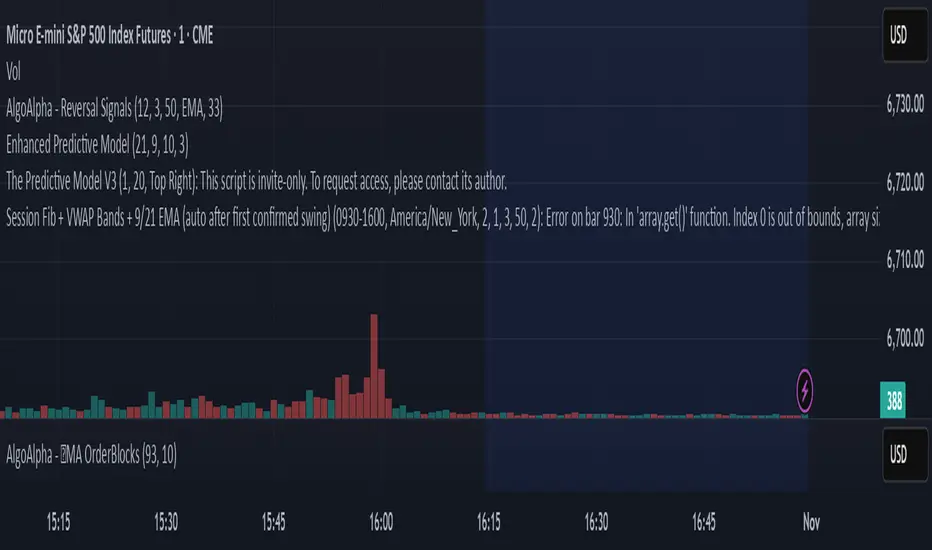
ShockDrop Alerts v1⚡ ShockDrop Alerts — Rapid Drop & Drawdown Detector
ShockDrop Alerts helps you react instantly to sudden market shocks.
It tracks both fast price drops and intraday drawdowns, plotting clean visual arrows and sending alerts when volatility spikes — so you can respond before small dips turn into major moves.
⚙️ How It Works
• Fast Drop (FAST) – detects sharp declines (e.g. 2 % in 4 minutes) using 1-minute data across any timeframe.
• Drawdown (DD) – triggers when price trades a set percentage below the day’s session high (e.g. 2 %).
Each alert type has its own independent cooldown timer and can be toggled on or off.
🎯 What You’ll See
• FAST → 🔴 red arrow above the bar (rapid drop detection)
• DD → 🟠 orange arrow below the bar (intraday drawdown)
These appear only when your defined conditions are met. Connect them to TradingView alerts for instant popup, email, mobile, or webhook notifications.
🧭 Key Features
• Detects high-velocity price shocks in real time
• Separate cooldowns for FAST and DD triggers
• Extended-hours toggle to include pre/post-market data
• Clean, clutter-free visuals — only actionable arrows
• Uses 1-minute precision data, works on any symbol or timeframe
• Supports server-side alerts (TradingView Pro +)
📬 Why Traders Use It
• Get early warnings during flash crashes or liquidity spikes
• Automate risk-based exits when markets accelerate downward
• Track SPY, QQQ, crypto, or futures for rapid reversals
• Stay alert to high-impact news events — such as surprise policy comments, earnings releases, or market-moving presidential posts — that can cause sudden volatility
Requires TradingView Pro + for continuous server-side alerting.

Shadow Corp 90min Boxes90-min cycle boxes, marks 90min session highs and lows with color coded boxes.
SW's Asia/London H/L'sAccurate Asia and London (with other session) High's and Low's. As well as NY Pre-market and opening bell, and end of day vertical lines. Also created 4 slots in UI to be able to set specific vertical lines with custom label options.
Multi-Session High/Low Trackertable that shows rth eth and full weekly range high and low with range difference from high and low

Customisable Asia & London Session High/Low (UTC+1)london + asia high / low
can customise however you like. its not perfect but saves time
Z-Score Multi-Model ClusteringA price/volume clustering framework combining three market behavior models into a single indicator. Designed to help identify emerging trend strength, turning points, and volatility-driven entries or exits.
🔍 How It Works
This indicator classifies market states by comparing normalized price/volume behavior (via Z-Score) to different types of statistical or geometric "cluster centers." You can choose from three clustering approaches:
🧠 Clustering Models
1. Percentile (Z+CVD) – Trend Momentum Bias
Uses volume Z-Score + Cumulative Volume Delta (CVD).
Detects institutional pressure by clustering volume surges with directional delta.
Best for: Breakouts, momentum trades, volume-led reversals.
Cluster Colors:
🔹 Green triangle = Strong bullish confluence
🔻 Red triangle = Bearish divergence (bull trap risk)
⚪ Gray = Neutral/low conviction
2. Euclidean (Z+Slope) – Swing Mean-Reversion
Measures the angle of recent Z-score slope and compares it to directional cluster centers.
Helps detect early directional shifts or exhaustion.
Best for: Swing entries, pullback setups, exit timing
3. Hilbert Phase – Turn Detection via Signal Phase
Applies Hilbert Transform to the Z-Score, measuring the phase difference between trend and oscillator components.
Ideal for anticipating turns or detecting cyclical inflection points.
Useful for: Scalping, top/bottom spotting, volatility fades
✅ Features
Auto-updating cluster logic based on current data
Tooltips and clean user interface
Optional cluster bar coloring (can be toggled off)
Signal-only plotting keeps candlesticks readable
Clear entry/exit logic with triangle markers
Supports trend, swing, and oscillation-based systems
🛠️ Suggested Use Cases
Combine with VWAP, Session High/Low, or Liquidity Zones to confirm entry conditions.
Use Cluster 2 (strong bullish) on pullbacks to trend structure for add-on entries.
Use Cluster 1 in strong trends to watch for potential traps or exits.
Toggle models based on your strategy: e.g., Hilbert for scalping, Percentile for macro trend breaks.
🧪 Best Timeframes
Works across all markets and timeframes
For Percentile (Z+CVD), use intraday TF with 1m–5m CVD source
Hilbert and Euclidean preferred on 5m–1h for accurate slope/phase signals
⚠️ Notes
Clusters do not generate trade signals alone; use them in context with structure, VWAP, or trend filters.
Marker signals are filtered with a magnitude threshold to reduce noise.

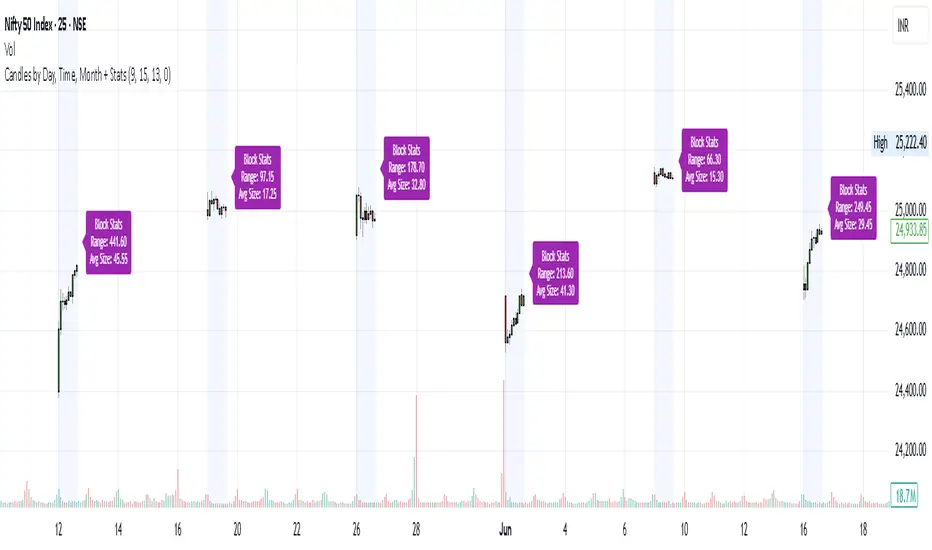
Candles by Day, Time, Month + StatsThis Pine Script allows you to filter and display candles based on:
📅 Specific days of the week
🕒 Custom intraday time ranges (e.g., 9:15 to 10:30)
📆 Selected months
📊 Shows stats for each filtered block:
🔼 Range (High – Low)
📏 Average candle body size
⚙️ Key Features:
✅ Filter by day, time, and month
🎛 Toggle to show/hide the stats label
🟩 Candles are drawn only for selected conditions
📍 Stats label is positioned above session high (adjustable)
⚠️ Important Setup Instructions:
✅ 1. Use it on a blank chart
To avoid overlaying with default candles:
Open the chart of your preferred symbol
Click on the chart type (top toolbar: "Candles", "Bars", etc.)
Select "Blank" from the dropdown (this will hide all native candles)
Apply this indicator
This ensures only the filtered candles from the script are visible.
Adjust for your local timezone
This script uses a hardcoded timezone: "Asia/Kolkata"
If you are in a different timezone, change it to your own (e.g. "America/New_York", "Europe/London", etc.) in all instances of:
time(timeframe.period, "Asia/Kolkata")
timestamp("Asia/Kolkata", ...)
Use Cases:
Opening range behavior on specific weekdays/months
Detecting market anomalies during exact windows
Building visual logs of preferred trade hours